
We know that trading stocks are harder. Well, read the stock chart is harder if you don’t know the proper ways to read it. So, many of you might sit back and think why to read the stock charts when it is that difficult, it is because, once you learn how to analyze a stock chart, your whole stock trading becomes easier. Learning how to understand a stock chart is the first step towards winning stock trades. So, in this session, we will be breaking down some of the essentials of the stock charts for you to understand clearly. Many stock market traders have tried to read the charts but their approach was not the correct one. So, bringing some changes can help traders to understand this important tool easily.
But first, let’s learn what a stock chart truly is.


To many of you, it is a chart that graphically represents information. Well, you are not wrong. It is a graph where the price changes are plotted in comparison with time frames.
That means, looking at a stock chart helps traders to know how the market is moving and what the market may look like in a couple of days. Furthermore, it helps a trader to find possible entry points to start a transaction.
Just like any other financial chart, the stock chart also shows the difference in prices using straight lines where moving upward means the demand of a stock is increasing and lines going downward denotes the downfall of a stock.
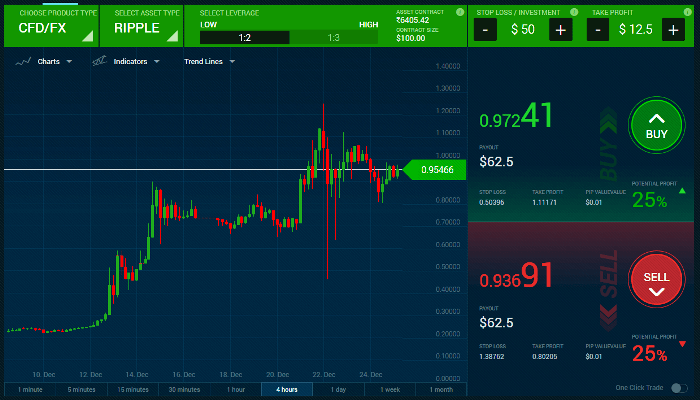
There are some in-app charts for traders using which they can easily buy any stock. These apps make stock trading way easier and help to keep the traders updated about the recent changes. Being remember, most of the smart investors in the United Kingdom rely on the https://www.home.saxo/en-gb/products/cfds broker to trade the CFD market.
How to read a stock chart?
There are some key factors to consider when it comes to reading a stock chart. These basics help a trader to better understand what is shown in the picture. So, let’s get started!
Understanding trend lines
Trend lines play a big role whenever it comes to trading the stock market. In the stock chart, every trading entry is recorded and after a certain duration, if these entries are smoothened, they show straight lines that may dive in or climb up. These upward and downward lines show market trends. If a straight line doesn’t go upward or downward, we will say that the market is going sideways. So, why are trend lines important? You need to know that no trend remains constant forever. Trends breakdown and convert into another trend and by analyzing the previous trends, traders can speculate what the future trends may look like.
Support and resistance
It is no wonder that a stock chart will have support and resistance levels. Support is the point at which a price gets hit and moves up thus making it the best position to buy some stocks. Again, resistance works in the same manner but in the opposite direction. Here, the price gets hit and goes downward. At support, a price is unlikely to fall below and even if it falls, it is considered a breakdown. In that case, the support becomes the new resistance and the point at which the price goes up becomes the new support.
Dividends and stock splits
When the owners of a company give a fraction of earnings to its shareholders, we call it dividend. In simpler words, a dividend is the profit investors make from investing in the stock market. Many companies issue dividends while many don’t. But just because a company is not issuing dividend does not mean it is a loss to invest in them.
When a stock split occurs, many investors get the chance to buy stocks but at a lower price. As a result, the overall share price of the company increases.
We know it can be a pretty rough road to master all the techniques of reading a stock chart. But, for the sake of your trade, you need to be patient enough and put your efforts to learn the stock charts.


